Evaluation: Usability
Method
- Should your concepts provide an interaction with the user, it might be useful to test their usability.
- You can evaluate Usability qualitatively and quantitatively. For qualitative evaluation, please refer to the Evaluation: Qualitative card.
- To learn more about the difference between qualitative and quantitative evaluation look at this card.
- To quantitatively evaluate the usability of the system, you can use the System Usability Scale (SUS) [1].
- It measures the product’s perceived ease of use, ease of navigation, task satisfaction and learnability.
- Around 30-40 testers are recommended for quantitative research.
- The ten items are rated via a 5-point
Likert scale (strongly disagree – strongly agree):
- I think that I would like to use this system frequently.
- I found the system unnecessarily complex.
- I thought the system was easy to use.
- I think that I would need the support of a technical person to be able to use this system.
- I found the various functions in this system were well integrated.
- I thought there was too much inconsistency in this system.
- I would imagine that most people would learn to use this system very quickly.
- I found the system very cumbersome to use.
- I felt very confident using the system.
- I needed to learn a lot of things before I could get going with this system.
Data Analysis
Score Calculation
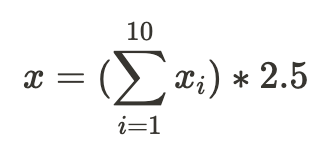
To get the score for the usability of the system (u) for each participant, you have to encode the five positive answers with 0 to 4 and the negative answers with 4 to 0.


Calculate the Cronbach Alpha value for your data. The Cronbach Alpha values should be greater than 0.7. It resembles the internal consistency of your scale. Low values could indicate that some items were interpreted unexpectedly by participants. If your Cronbach Alpha Score is low, you should be careful when interpreting the results. A free online calculator can be found here. Insert all your raw values, one column per item. Do not calculate the Alpha Score for each question, but for all 10 of the SUS questionnaire at once.
Comparing two or more groups statistically
Interpreting the Results
- The SUS score is usually expressed as a percentage.
- The higher the score, the better usability of the system.
- If a system has reached 100 percent, it is perfect. Scores of up to 70 percent are considered good usability, while scores of less than 50 percent are considered severely deficient in terms of usability.

- If you have multiple interaction concepts, it is recommended to perform A/B testing to better understand the values and see how much they differ.
Sources
[1] - Brooke, John. "SUS-A quick and dirty usability scale." Usability evaluation in industry
189.194 (1996): 4-7.[2] - Bangor, Aaron, Philip Kortum, and James Miller. "Determining what individual SUS scores mean: Adding an adjective rating scale." Journal of usability studies 4.3 (2009): 114-123.