
Evaluation: Perceived Feeling of Safety
Method
- To learn more about the difference between qualitative and quantitative evaluation look at this card.
- To quantitatively evaluate the perceived feeling of safety, we recommend using three items of the autonomous vehicle acceptance model (AVAM) questionnaire [1] (item 24, 25 and 26).
- Around 30-40 testers are recommended for quantitative research.
- The three items are rated via a 7-point
Likert scale (strongly disagree – strongly agree):
- I believe that using the vehicle would be dangerous.
- I would feel safe while using the vehicle.
- I would trust the vehicle.
Data Analysis
Important: The first item needs to be reverse coded for every participant before evaluating the results! 1 becomes 7, 2 becomes 6 and so on.
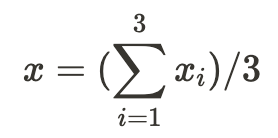
Score Calculation
To get the score for the perceived feeling of safety (x) for each participant, you have to sum up the three items and divide them by 3.
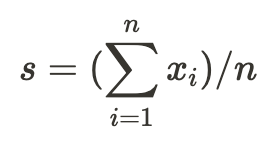
To get the score for the perceived feeling of safety (s) for all participants, you have to sum up all the individual perceived feeling of safety scores (x) and divide them by the number of participants (n).
Calculate the Cronbach Alpha value for your data. The Cronbach Alpha values should be greater than 0.7. It resembles the internal consistency of your scale. Low values could indicate that some items were interpreted unexpectedly by participants. If your Cronbach Alpha Score is low, you should be careful when interpreting the results. A free online calculator can be found here. Insert all your raw values, one column per item. Do not calculate the Alpha Score for each question, but for all 3 safety questions at once.
Comparing two or more groups statistically
Reporting Results Sample
“Providing feedback significantly increased the perceived feeling of safety compared to not providing feedback (Mfeedback = 3.74, Mno-feedback = 1.65, p < .05)"
Interpreting the Results
- The higher the score, the better the perceived feeling of safety.
- It is recommended to perform A/B testing to better understand the values and see how much they differ. For example, one group is provided with transparency-communication, and the other group is not.
- Furthermore, suppose qualitative data is present (e.g. interviews or think-aloud, see section Qualitative Evaluation). In that case, you should use it for interpreting and discussing the quantitative results of the perceived feeling of safety to get a better understanding.
Sources
[1] - Hewitt, Charlie, et al. "Assessing public perception of self-driving cars: The autonomous vehicle acceptance model." Proceedings of the 24th international conference on intelligent user interfaces. 2019.