
Evaluation: User Experience
Qualitative Evaluation
You can evaluate User Experience qualitatively and quantitatively. For qualitative evaluation, please refer to the Evaluation: Qualitative card.
Quantitative Evaluation
- To learn more about the difference between qualitative and quantitative evaluation look at this card.
- To quantitatively evaluate the User Experience, you can use the short version of the User Experience Questionnaire: UEQ-S [1].
- The questionnaire can be downloaded here. More information can be found at https://www.ueq-online.org.
- Around 30-40 testers are recommended for quantitative research.
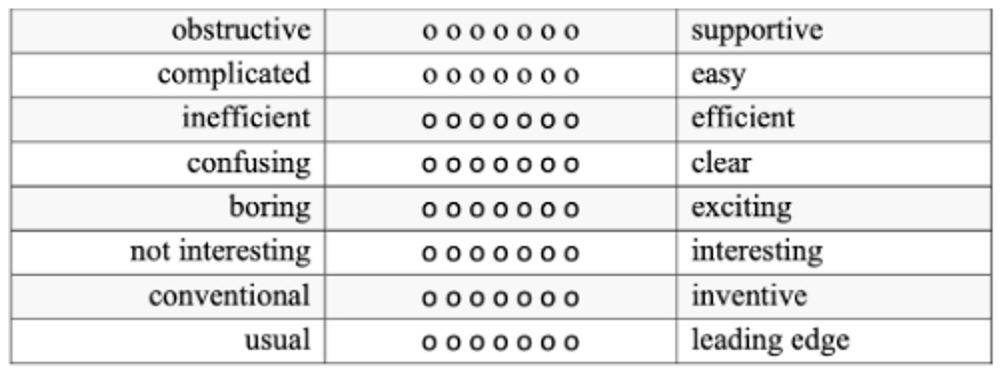
- Four semantic differentials each are used to measure the pragmatic and hedonic quality of the product. The pragmatic quality describes the perceived usability of the product. The hedonic quality is about feelings, fun, emotions, …
- The items are rated via a 7-point Likert scale
- There is an extended version with 26 items that you can also use. However, in our experience, the short version is beneficial (time-wise) as you will use multiple quantitative and qualitative research techniques to evaluate your concepts.
Data Analysis
- The UEQ-S conveniently comes with an Excel data analysis tool that helps you to easily evaluate your participants’ responses. You can download the Excel here. Every tab provides an explanation of its content.
- Horizontally enter your participants’ responses on the “Data” tab.
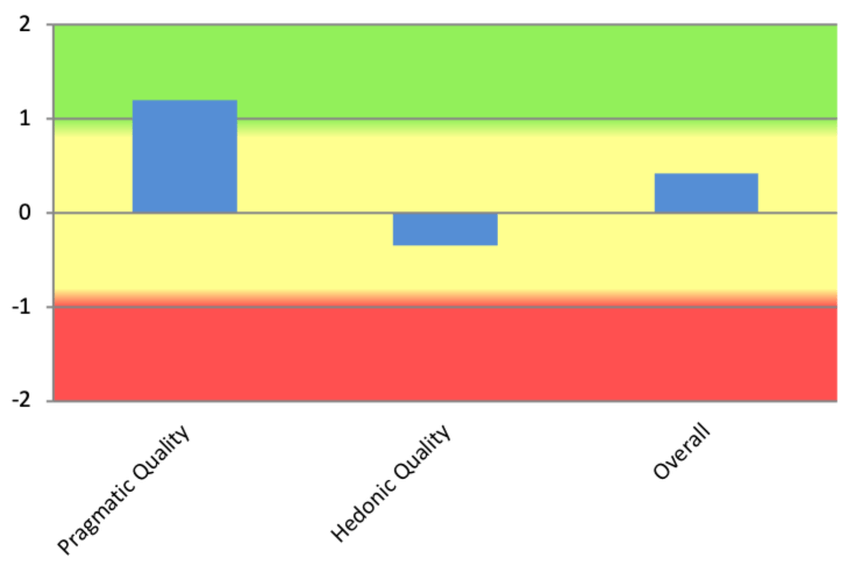
- The “Results” tab will provide you with an evaluation of your data. Here, you are provided with all relevant values, such as PQ, HQ, overall score and their means, standard deviations, etc. Values between -0.8 and 0.8 are considered neutral. Lower values are considered negative, and higher values are considered positive. The goal is to have a positive PQ, HQ and overall score.
- Make sure to inspect the “Scale_Consistency” tab after entering all the data. The Cronbach Alpha values should be greater than 0.7 for the PQ and HQ. It resembles the internal consistency of your scale. Low values could indicate that some items were interpreted unexpectedly by participants. If your Cronbach Alpha Score is low, you should be careful when interpreting the results.
Comparing two or more groups statistically
Reporting Results Sample
“The evaluation shows a positive pragmatic quality of 1.10 (SD=0.73, α=0.73) and a neutral hedonic quality of 0.60 (SD=1.32, α=0.65). The overall user experience is rated positive with 0.85 (SD=0.96).”
Interpreting the Results
Ideally, the PQ, HQ and overall score should be positive. The higher, the better.
It is not enough to look at the overall score. You should also look at the pragmatic and hedonic quality separately to understand the overall score better.
To better understand the PQ and HQ scores, it can be helpful to look at the results of every semantic differential. Here you can see if single items scored especially good or bad.
Furthermore, suppose qualitative data is present (e.g. interviews or think-aloud, see section Qualitative Evaluation). In that case, you should use it for interpreting and discussing the quantitative results of the UEQ-S to get a better understanding.
Sources
[1] - Martin Schrepp, Andreas Hinderks, and Jörg Thomaschewski. 2017. Design and Evaluation of a Short Version of the User Experience Questionnaire (UEQ-S). IJIMAI 4, 6 (2017), 103.